Summary
- System architecture
- Heuristic-based interpretation and inference
- Sensor model
- Probabilistic Inference over RFID Streams
in Mobile Environments
- RFID supply chain simulator
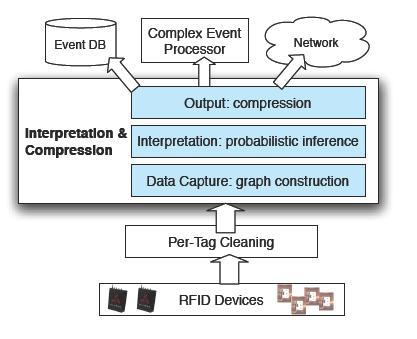
The SPIRE system employs a data interpretation and compression substrate. The substrate, epicted in Fig.1, consists of the following three modules:
- data capture
module that implements a stream-driven construction of a time-varying
graph model to encode possible object locations and containments.
- Interpretation
module that employs a probabilistic algorithm to estimate the most
likely location and containment for an object.
- Compression module that outputs stream data in an compressed format.

Figure 1 Architechure of SPIRE system
Heuristic-based interpretation and inference
Time-varying
colored graph model G=(V,E)
encodes the current view of the objects in the physical world,
including their reported locations and (unreported) possible
containment relationships. In addition, the model incorporates
statistical history about co-occurrences between objects.
The node
set V denotes all RFID-tagged objects in the physical world. Our graph
is arranged into layers, with one layer for each packaging level. Each
node has a color that denotes its location.
The directed edge set E encodes possible containment relationships
between objects.To enable
probabilistic analysis, the
graph also encodes rich statistics. Each edge maintains a bit-vector recent co-locations to
record recent positive and negative evidence for the co-location of the
two objects. Figure 2 is an example.

Figure 2 An example of Time-varying colored graph
Given that the read rate of an RFID reader is less than 100%, it is natural to model the reader's sensing region in a probabilistic manner: each point in the sensing region has a non-zero probability that represents the likelihood of an object being read at that location. To determine the probabilistic values for different points, we can represent the sensing region as the likelihood of reading a tag based on the factors including the distance and angle to the reader.
Probabilistic Inference over RFID Streams in Mobile Environments
The
task of data cleaning and transformation is essentially to recover the
facts necessary for query processing while mitigating the effects of
data loss and sensing noise. Toward this goal, we employ a principled
probabilistic approach to (1) model precisely how mobile RFID data is
generated from those facts about the physical world and (2) infer
likely estimates of the facts as noisy, raw data streams arrive.
Modeling
the data generation process. First, we design a probabilistic model
that captures the underlying data generation process, including the key
components such as reader motion, object dynamics, and noisy sensing of
these objects by the reader. In particular, our model employs a
flexible parametric RFID sensor model that can be automatically and
accurately configured for a variety of environments using a standard
learning technique.
Efficient, scalable inference. To generate
clean location event streams from noisy, raw RFID data streams, we
apply a sampling-based inference technique, called particle filtering,
to the probability distribution developed above. To enhance particle
filtering to scale to large numbers of objects and keep up with
high-volume
streams, we develop advanced techniques, namely,
particle factorization, spatial indexing, and belief compression. These
techniques lead to a solution that uses only a small number of samples
at any instant by focusing on a subset of the objects, while
maintaining high inference accuracy.
In order to design a distributed system for tracking and querying massive amounts of RFID tag data in a supply chain scenario, it is first necessary to create large data sets of sample data that can be used for testing during the design process. The purpose of RFID tag supply chain simulator is to create sample output files that will simulate the reads that a large set of products would create during their route through a retail supply chain.
This simulator is written in C++ and requires the use of the csim software library by Mesquite Software. It also uses TinyXML, an open source XML parser, in order to implement an xml configuration file that dynamically defines the supply chain at runtime. Information about the EPC tag data standards can be viewed in the standards document on the EPC Global website.
Architecture

Figure 3 Use Case Diagram
Figure
3 describes interaction between external entities which locates outside
of the system boundary. Two actors will interact with this simulator,they
are Tester and RFID Middleware. Tester will run the simulator to
generate trace file and RFID middleware use these file to work on RFID
stream data. This Use Cases of RFID supply chain simulator include: Run
simulator, Parse configuration file, Generate object, Move object, Run
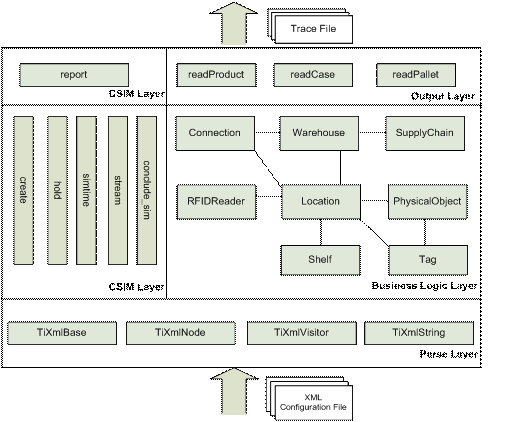
reading process, Generate trace files. Figure 4 shows the module view
of overall architecture of this simulator.

Figure 4 Module View